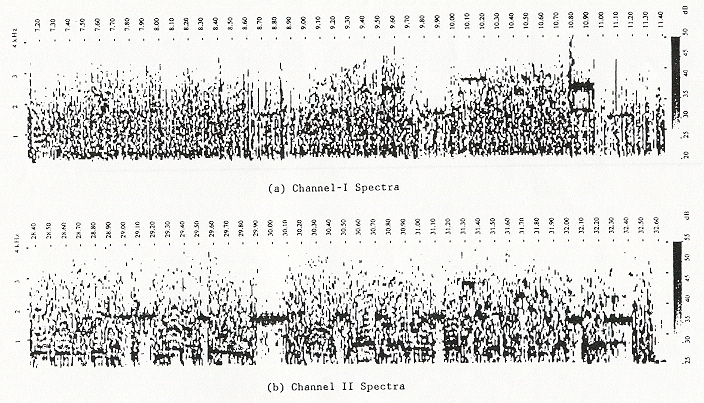
Figure 3. Spectra of Channels I and II for the "Hold-Everything" segment. The horizontal axis is time (seconds) and the vertical axis is frequency (kHz). The grey intensity-scale (dB) is indicated at right. Note the reduced Channel-I spectral intensity following the two heterodynes (9.52 to 9.64 and 10.78 to 10.95 secs).
Minimize this window to return.
Back to archive of acoustical evidence
Back to JFK reports and documents menu