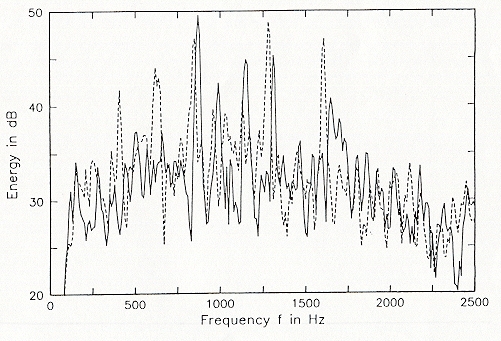
Figure 13. A high resolution energy density plot of the two segments of the second "Bell" sound. The solid curve is for the first segment (10.40 to 10.60 secs) and the broken line is for the second segment (10.85 to 11.10 secs). Note the prominent second and third harmonics around 850 and 1300 Hz respectively.
Minimize this window to return.
Back to archive of acoustical evidence
Back to JFK reports and documents menu