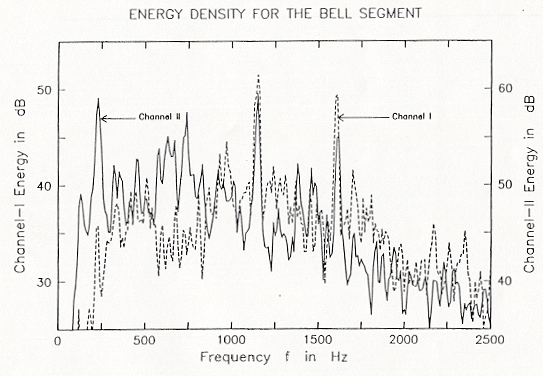
Figure 11. A high resolution energy density plot of the two spectra for the "Bell" segment. The horizontal axis is time (seconds) and the vertical axis is frequency (kHz). The solid curve is for the Channel II and the broken curve is for the Channel I. Note the prominent fundamental at 230 Hz, and the fifth and seventh harmonics at 1150 and 1620 Hz respectively.
Minimize this window to return.
Back to archive of acoustical evidence
Back to JFK reports and documents menu