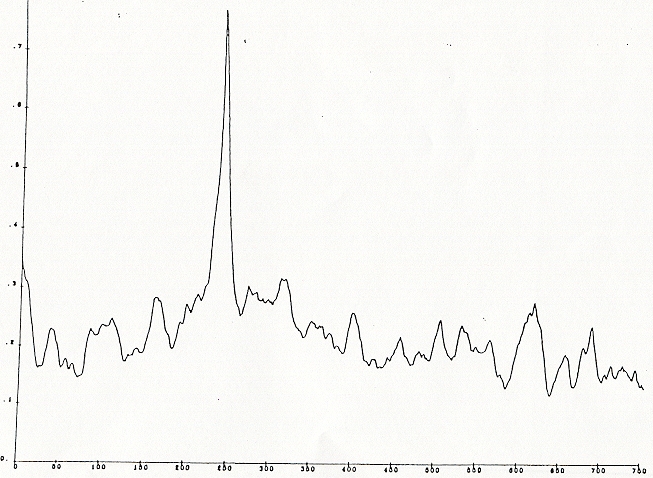
Figure 2. Cross-correlation between "Stemmons" segments of Channel I and II spectra. The curve is produced by sliding 2.50 secs of the Channel-I spectra along 10.00 secs of the Channel-II spectra, 0.01 sec at a time, using frequencies in the band 600-3500 Hz. The horizontal axis is time (centiseconds) and the vertical axis is the corss-correlation coefficient (ρ).
Minimize this window to return.
Back to archive of acoustical evidence
Back to JFK reports and documents menu