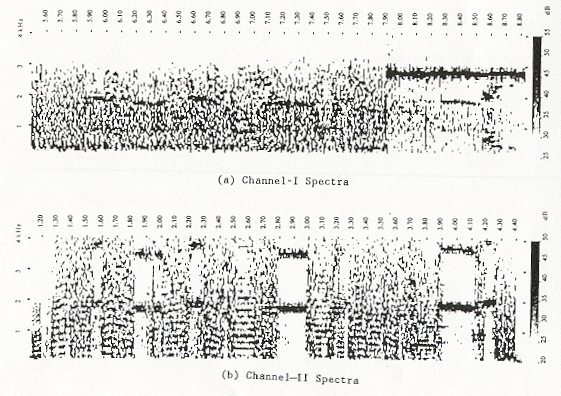
Figure 4. Spectra of Channels I and II for the "Pre-Stemmons" segment. The horizontal axis is time (seconds) and the vertical axis is frequency (kHz). The grey intensity-scale (dB) is indicated at right. Note the reduction in the Channel-I background and the Channel-II cross-talk level as the heterodyne begins at 7.91 secs.
Minimize this window to return.
Back to archive of acoustical evidence
Back to JFK reports and documents menu