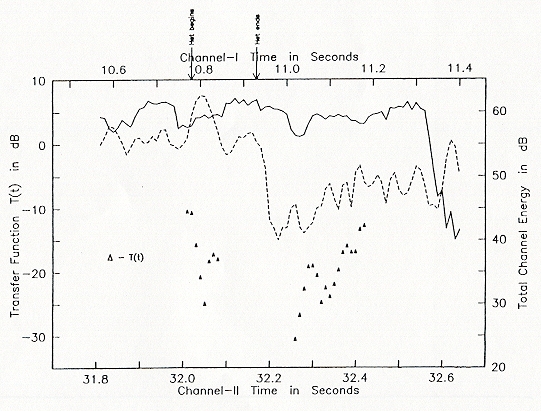
Figure 9. Plot of total Channel energy and the transfer function T(t) from Channel II to Channel I, for the last part of the "Hold-Everything" segment. The solid curve is for the Channel-II energy and the broken curve is for the Channel-I energy. T(t) (represented by Δ) is plotted only for frames containing a Channel-II brieftone. Timings of the "Shots" and the Channel-II heterodynes are also indicated. Note the drop in T(t) as the heterodyne begins and its recovery after the heterodyne end [sic].
Minimize this window to return.
Back to archive of acoustical evidence
Back to JFK reports and documents menu