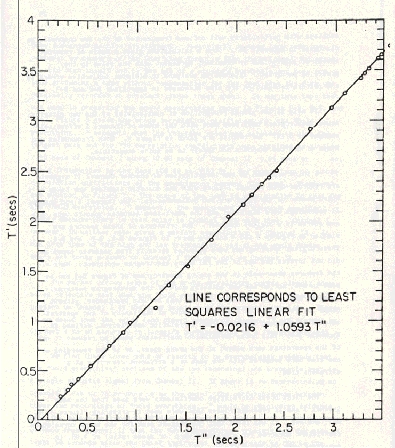
Figure 5. Plot of T' versus T" for corresponding characteristics with the values of Table B-1. The marked linearity of the curve demonstrates the validity of the identification. The straight line in the figure is a plot of the given equation, which in turn is a robust linear regression fit to the plotted points. The analysis leading to this figure is given in Appendix B and Table B-1. The point furthest off the line is at T" = 1.195s and is for the incorrectly identified characteristic I, as discussed in Appendix B.
Minimize this window to return.
Back to archive of acoustical evidence
Back to JFK reports and documents menu